 Basic Research Questions:
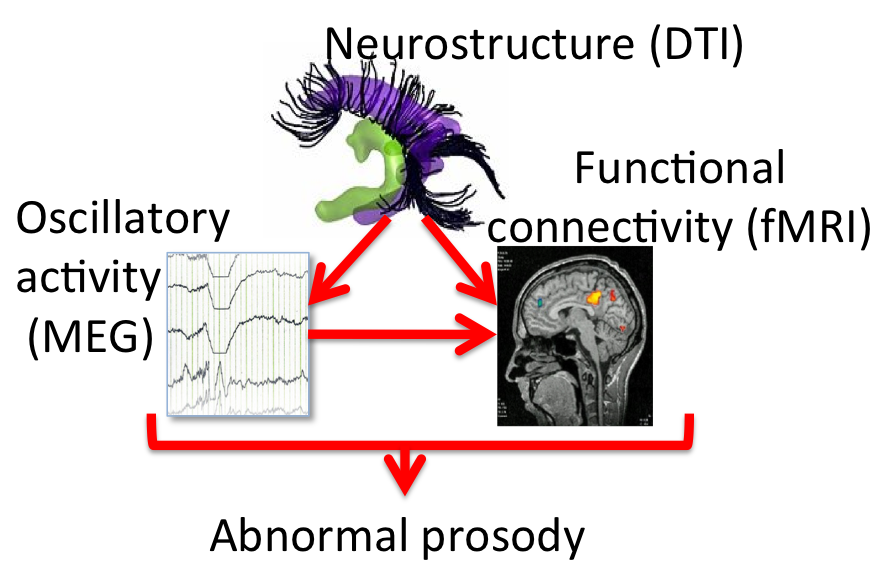
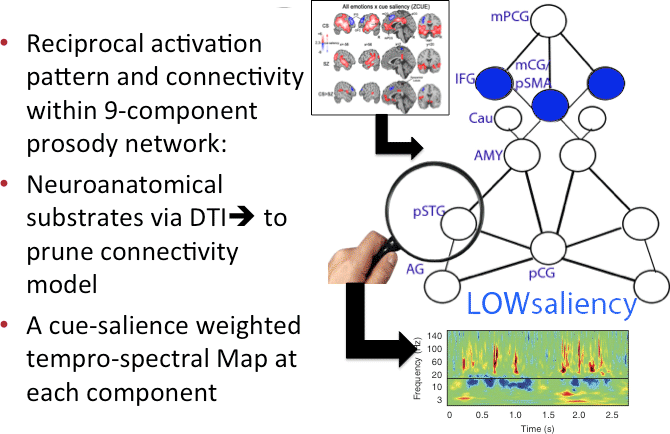
We have adopted a multi-stage model of prosodic processing. Prior fMRI suggested that affective prosodic identification utilizes a reciprocal temporo-frontal neural circuit comprising the cortical and subcortical Regions of Interest (ROI’s). In this study, we are employing multimodal neuroimaging (EEG, MEG, fMRI, & DWI) to examine the tempro-frontal reciprocal model in real time, as well as examining the effects of structural fiber pathway integrity on functional integration. A reciprocal activation pattern and connectivity within a 9-component prosody network was observed.
To download the BIOMAG2014 Presentation, click here.
Prosody and Acoustic Cues That Predict Emotion Identification
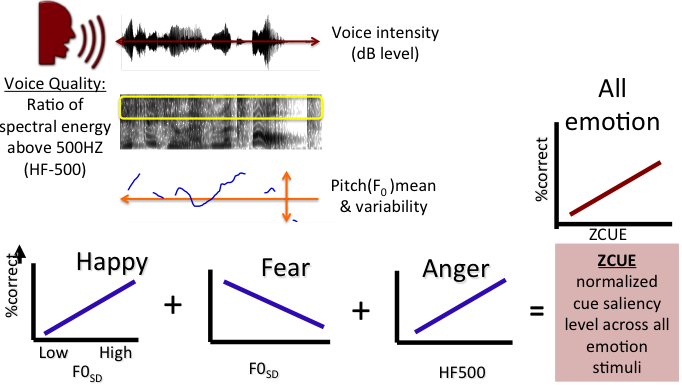
For example, using our stimuli we found positive correlations between pitch variability ( fundamental frequency (F0SD) and the probability of recognizing happy utterances correctly. decreasing pitch variability was inversely correlated with correctly identifying fear, while correctly identifying anger was correlated with increased high frequency energy meandered as ratio of energy (power) in the stimulus above 500Hz. with example. to examine the richness of these emotion-specific cues across all emotions we can calculate the z-transform of the cues within each emotion and derive a cross emotion cue salience value (ZCUE)
Affective prosodic processing model and the temporo-frontal reciprocal processing network
First, the stimulus undergoes low level auditory processing. We extract cues like pitch, intensity, and the spectrum and integrate them together in an attempt to evaluate the meaning of the cues and attribute the emotion. To complicate things further, this can be both a top-down and bottom-up process. A disruption could occur during any point in this process to impair the ability to accurately perceive and evaluate prosodic cues. We hypothesize that stimuli with greater cue saliency will be more easily recognized and thus will result in increased facilitation of feature extraction and integration, while lower cue saliency may require more evaluation and result in top-down modulation.

fMRI Experiment: CUE-SALIENCY modulated Activation Changes IN Healthy Individuals (CS) and Individuals with Schizophrenia (SZ)
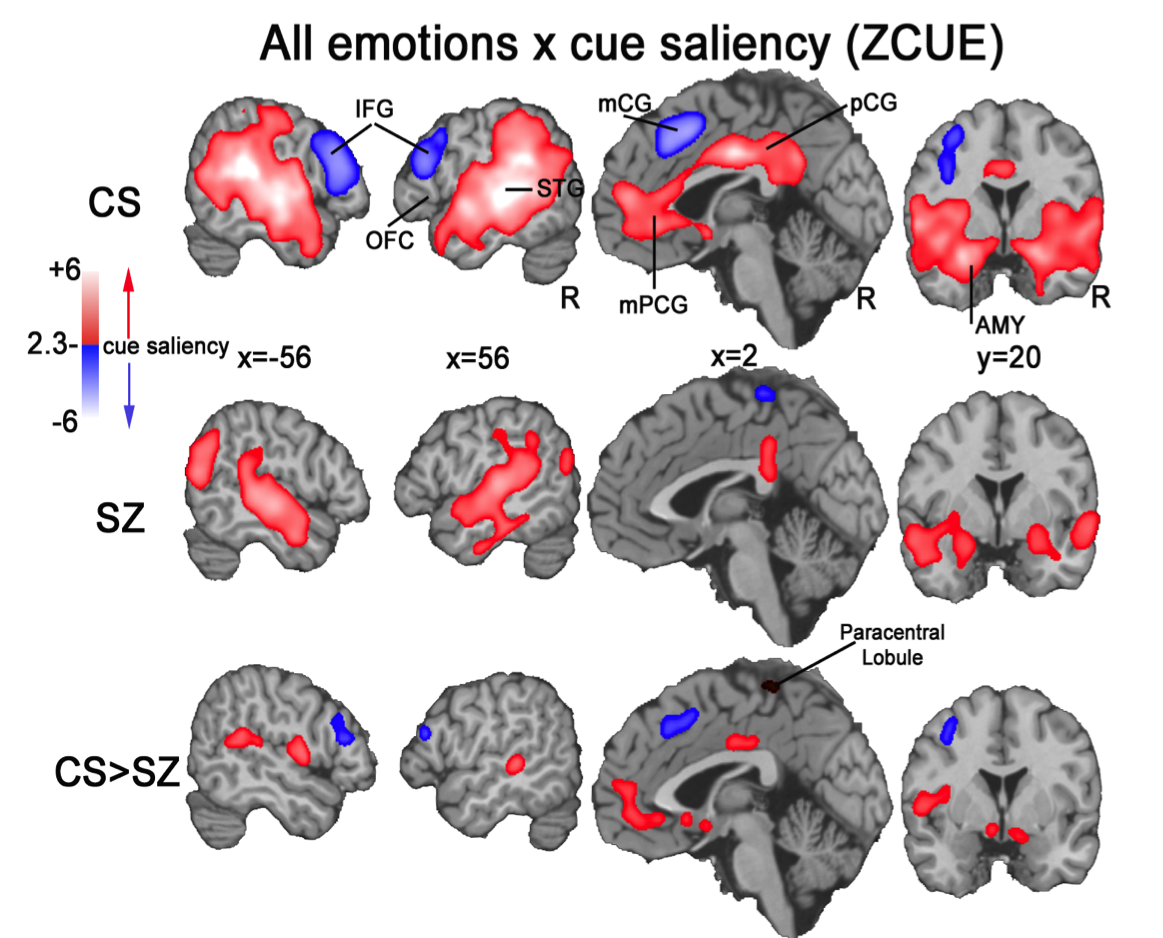
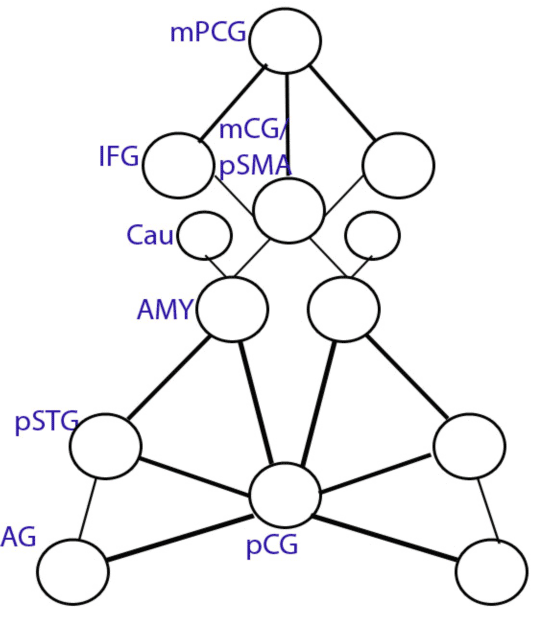
Left: Activation changes across emotions that correlated with cue salience level (ZCUE). For control subjects, cue salience increases (RED) were correlated with increased activation in superior temporal cortex, posterior cingulate gyrus (pCG), ventromedial anterior cingulate (vmaCG), and AMY. Decreasing cue salience (BLUE) correlated with increased frontal activity within IFG and mCG. In subjects with schizophrenia, reduced correlated activation in all control regions relates to increasing cue salience, as well as reduced IFG and mCG activation to cue salience decreases. Right: scematic of 13-node affective prosodic network as modulated by Cue saliency (ZCUE)
Multimodal Study
The Multimodal study seeks to first extend our explorations of the effects of CUE-salience modulation on the dynamics of the temoporo-frontoal reciprocal network, to5-dimensions Time, space and time-frequency space. Thus for each node or ROI within our network we seek to identify time and frequency of cue salience modulation or a tfROI
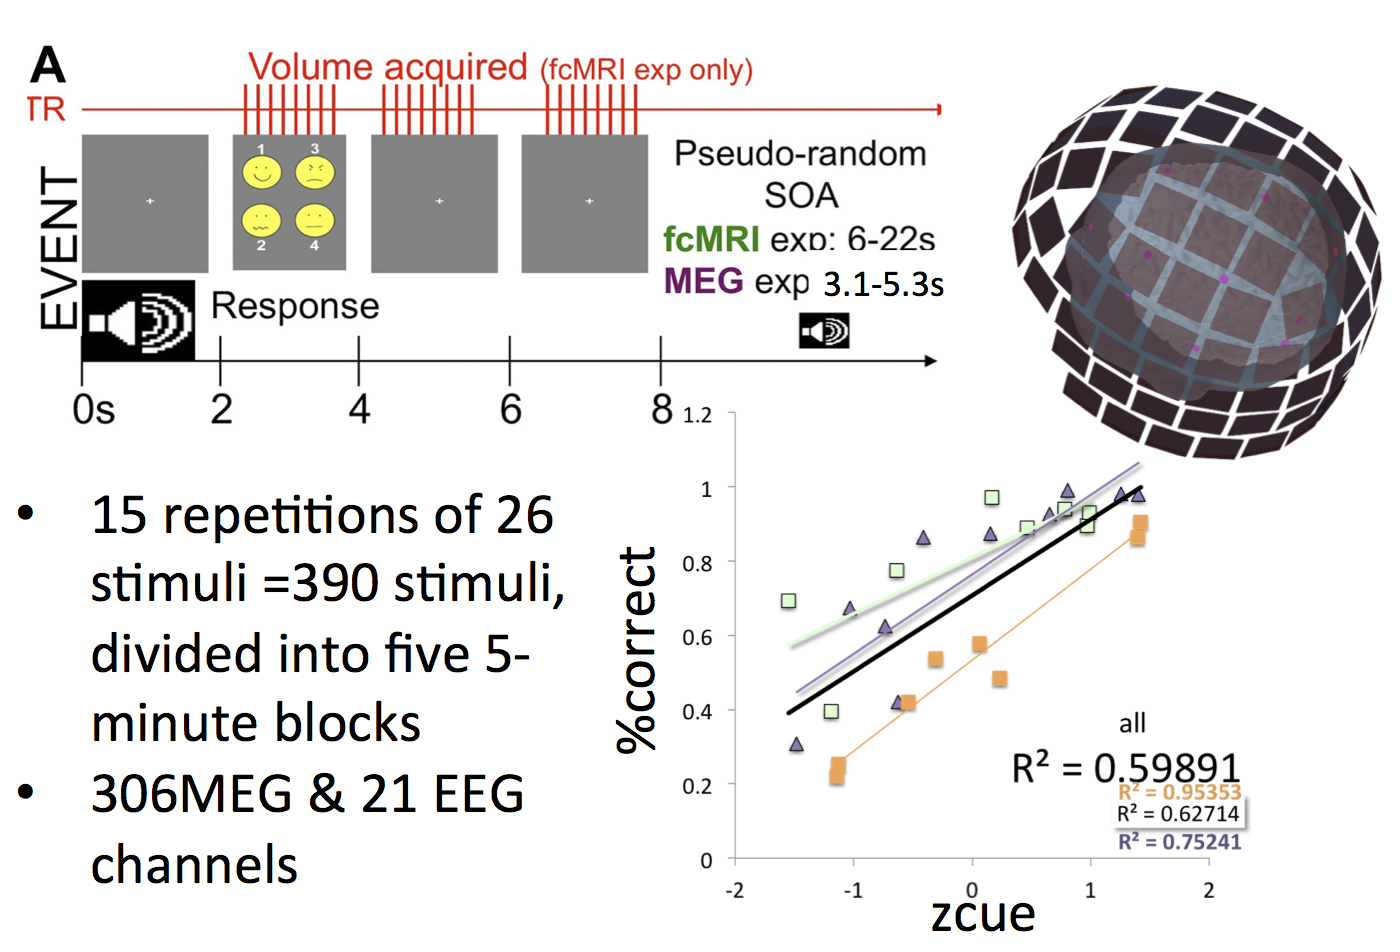
Setup and paradigm
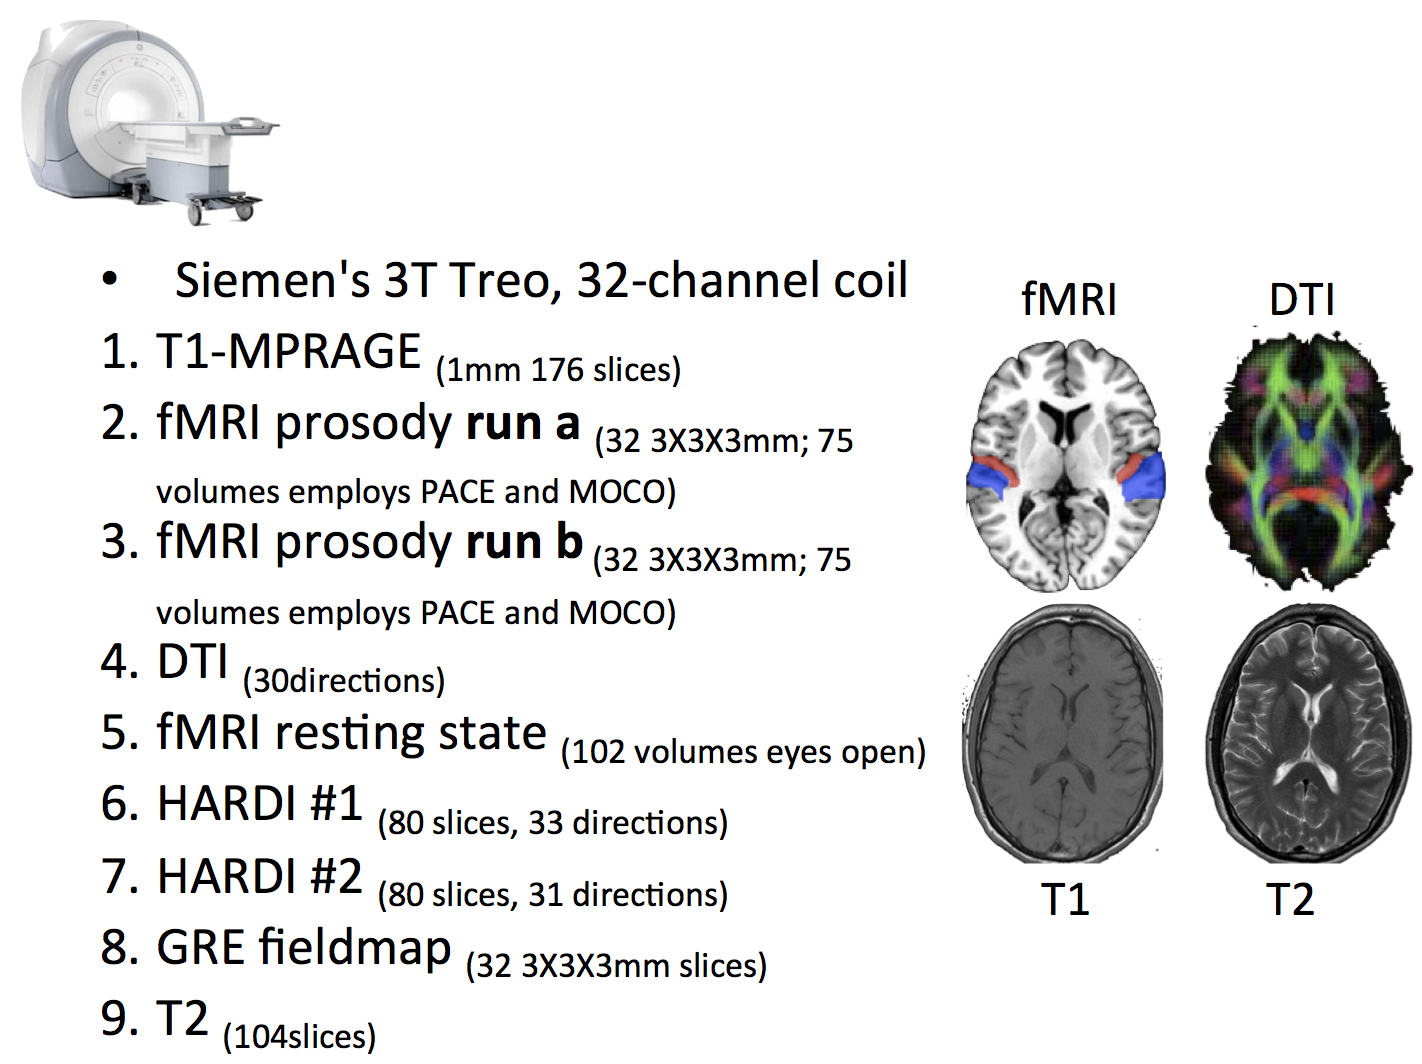
MRI data collection
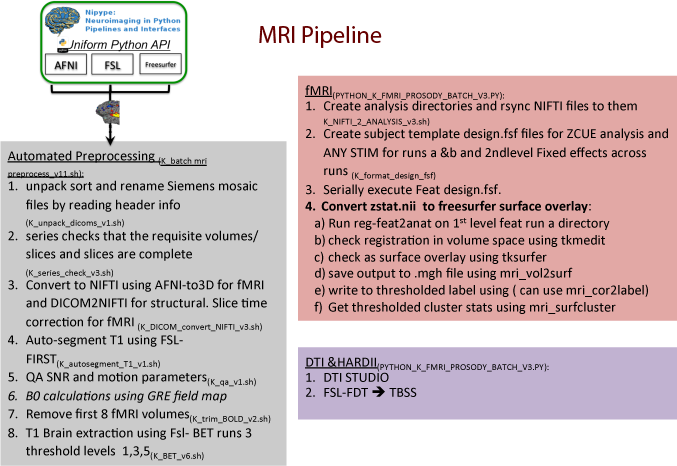
PYTHON-based automated processing and analysis pipeline
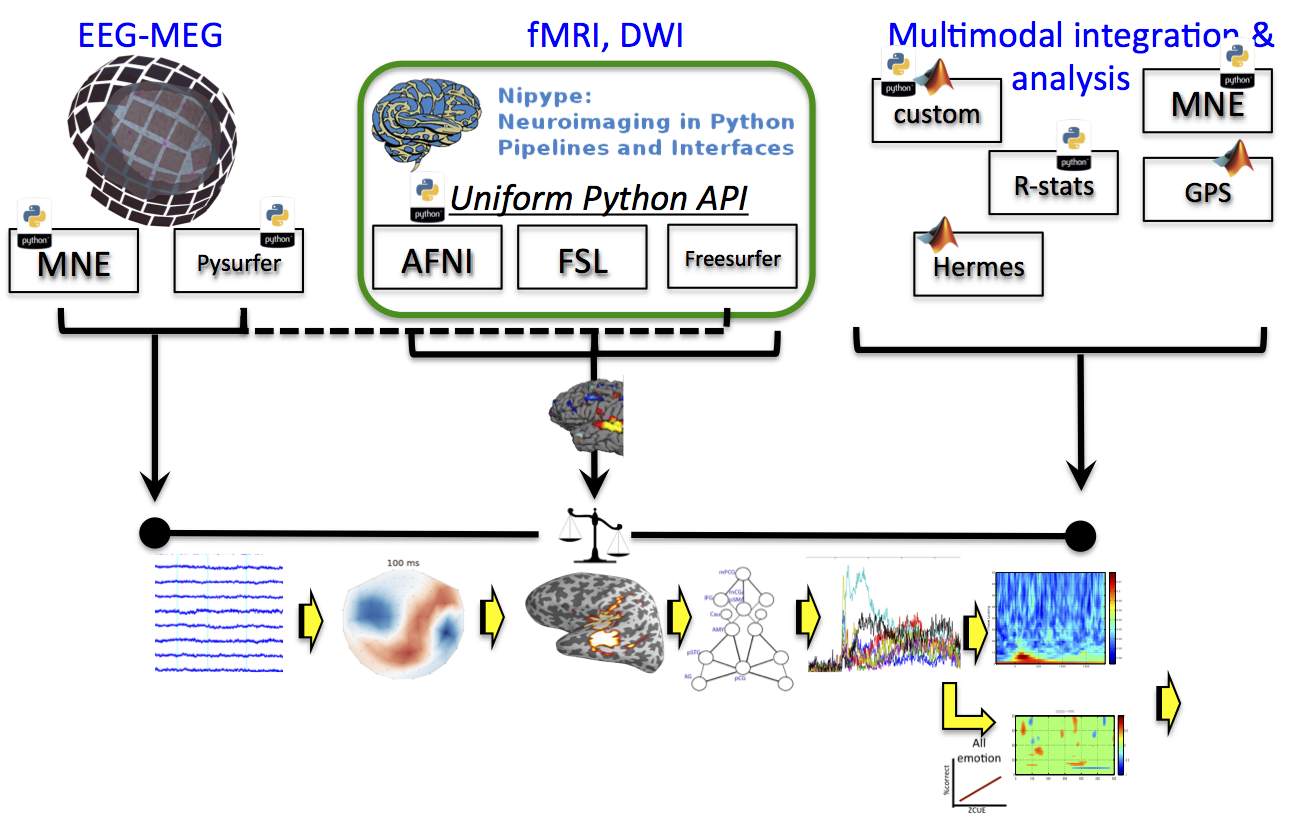
EEG/MEG Pipeline
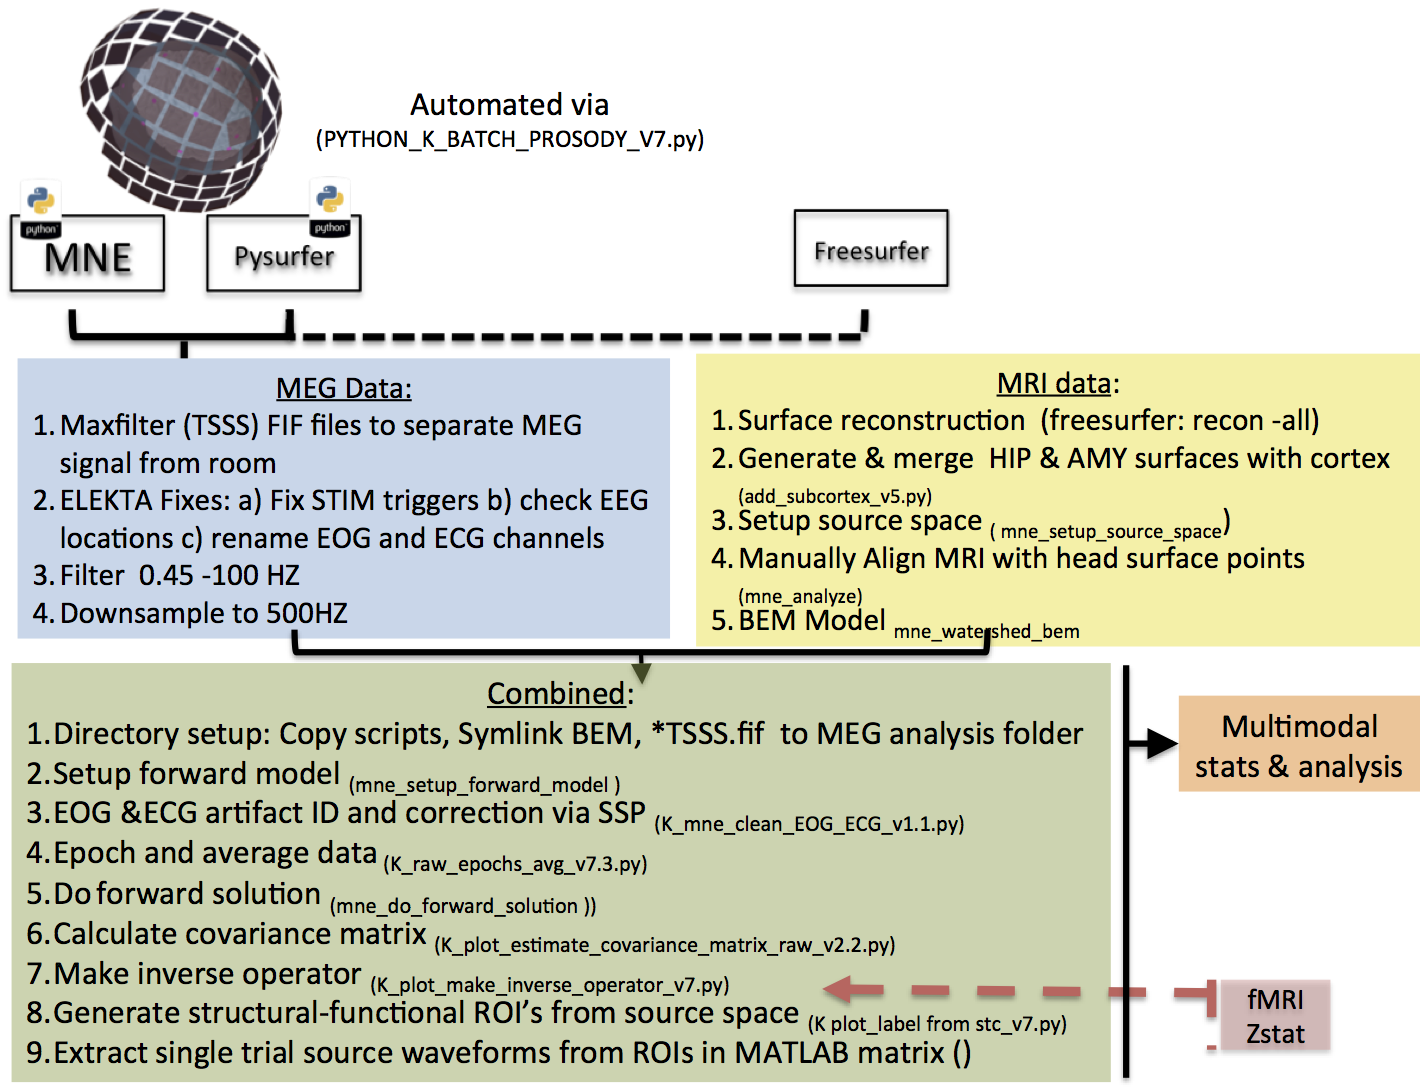
MRI Processing
EEG-MEG Prosody movie
Here, you can see areas of the brain that become active while perceiving prosodic stimuli:
Spotlight on the Amygdala
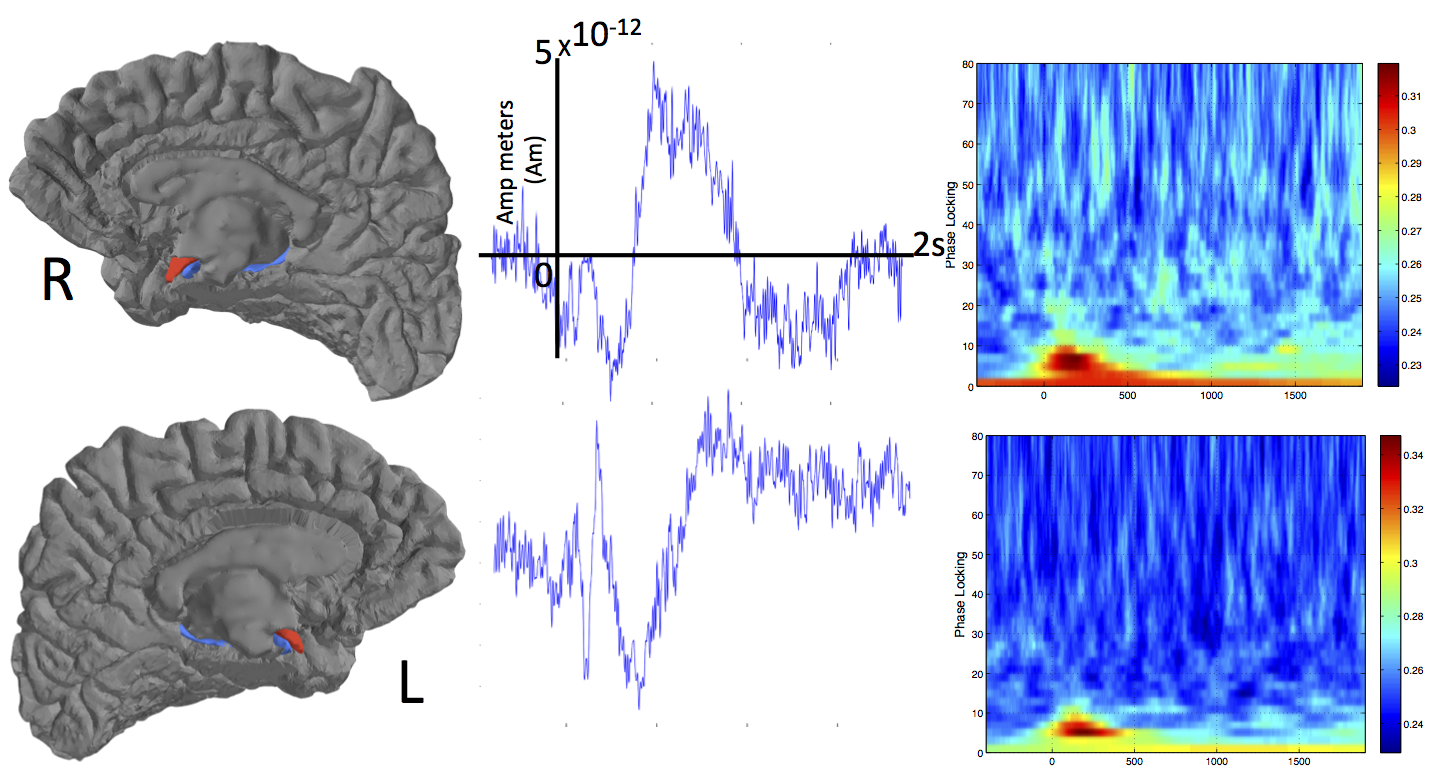
Emotional cue saliency modulation of post stimulus oscillatory activity:
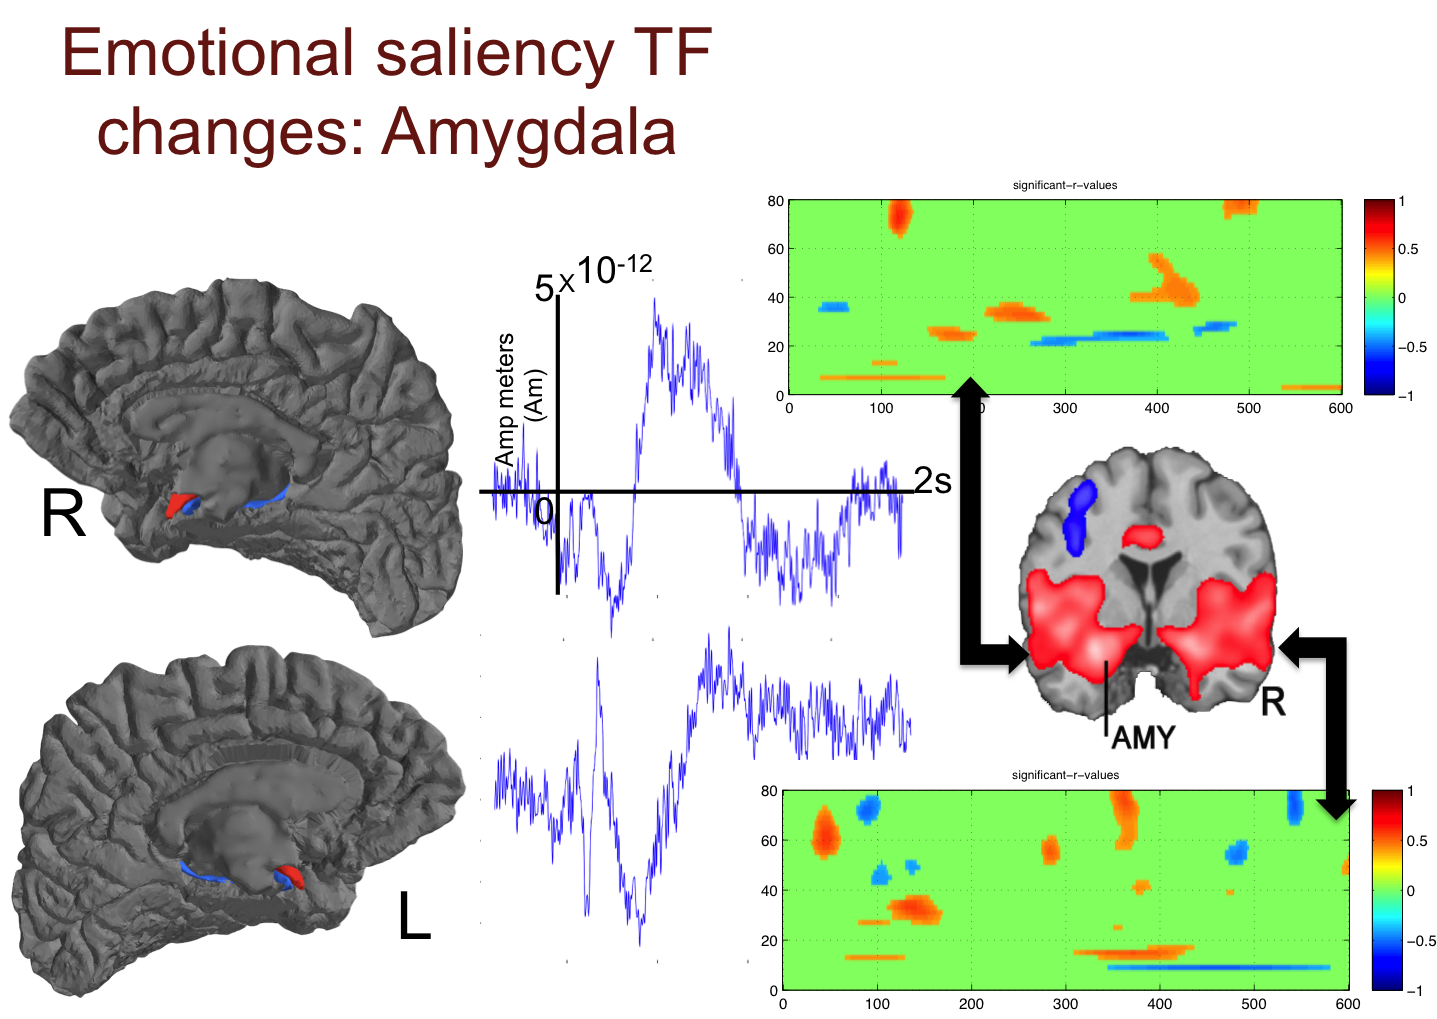
Emotional saliency TF changes: AmygdalaEmotional cue saliency modulation of post stimulus oscillatory activity:
MNE surface signal source projection for prosody timeseries from Amygdala ROI for each trial is transformed into time frequency space using wavelet decomposition. The each point in time frequency (TF) space is correlated with cue saliency level (ZCUE: level 1-26). The resulting map is then corrected for multiple comparisons using Monte-Carlo simulation. Correlation-TF maps indicate correlated increases in phase locking (PLV) associated with increasing ZCUE (Hot colors) and increasing PLV associated with decreased ZCUE (cold colors) or increased ambiguity of emotional intent.
MGN to primary auditory cortex Pathway
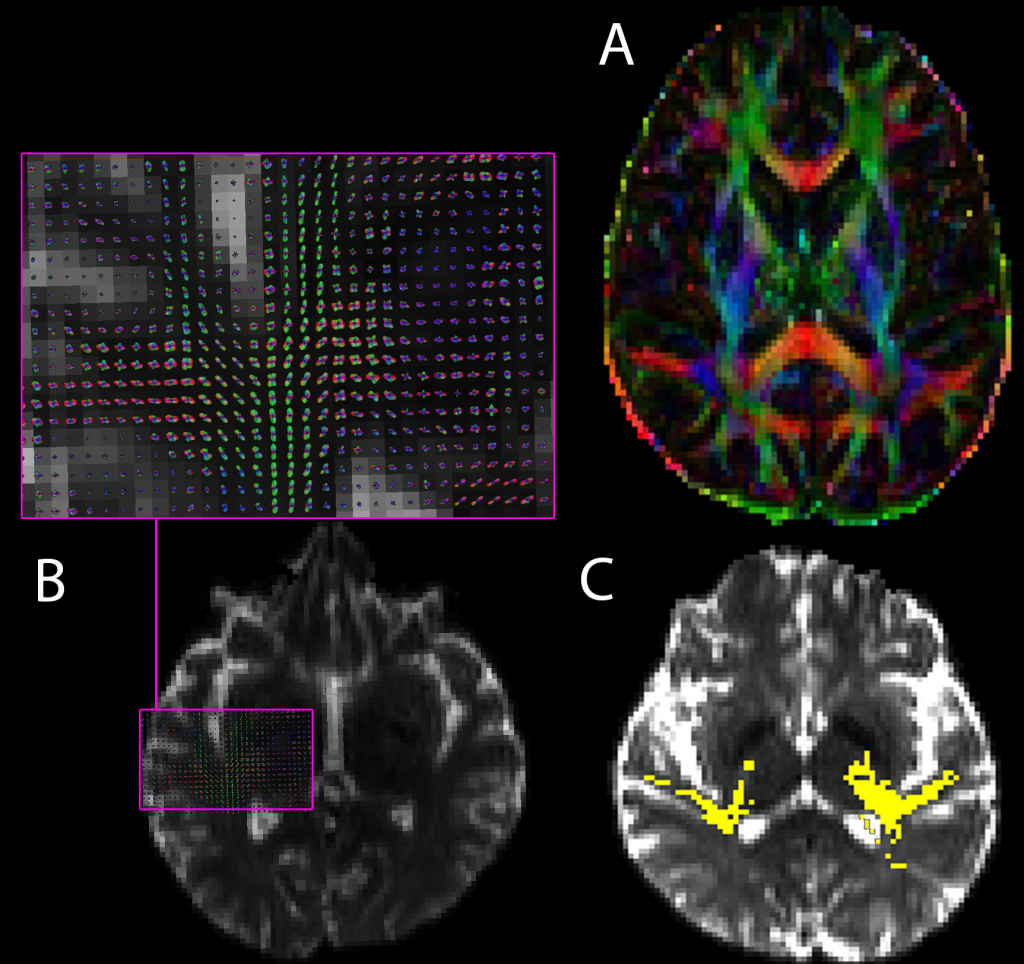
- DTI and HARDI (Inset) at acoustic radiations and ILF junction

A) FA color map in the axial plane showing medial-lateral oriented fibers (RED) rostral caudal fibers (GREEN) and dorsal-ventral oriented fibers(BLUE) B) HARDI up close with inset showing fiber[voxel] trajectories. C) Probabilistic tractography of acoustic radiations from MGN thalamus to primary auditory cortex.
Functional and effective connectivity guided DWI Fiber tracking
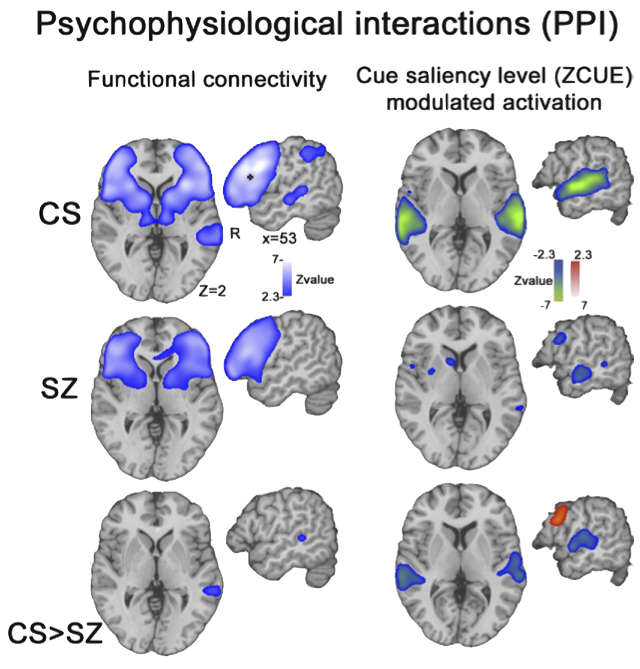
Functional connectivity and PPI: left: functional connectivity or correlated timeseries changes between right IFG seed region (denoted in gray) and the rest of the brain. Both groups display a bilateral pattern of correlated frontal/ caudate activation. The CS > SZ contrast indicates patients have reduced IFG–right STG connectivity. Right: in CS, de- creasing cue salience increases IFG–STG functional coupling, whereas increasing cue salience decreases this coupling. In SZ this modulation is significantly lower. Decreasing cue salience within SZ correlated with significantly greater func tional coupling between right IFG and more dorsal aspects of frontal cortex (red).
Using the PPI approach combined Multimodal activations within each ROI of the affective prosodic processing networks(see above) with be used recursively as source and destination seed for probabilistic tractography of HARDI guided DTI data. Measures of Mean and Radial diffusivity as well as Fractional Anisotropy (FA) will then be calculated as a proxy of fiber pathway integrity across subjects. These estimates will then be incorporated in a formal statical model examining their putative influence on oscillatory activity within and across regions.
Probabilistic Tractography Pathways
Here, we see the group average pattern of probabilistic tractography between functionally and anatomically defined Prosody Neural Network (PNN). Amygdala-cortical functional connectivity displayed a distinct, robust, and temporally-evolving pattern, casting amygdala as a central PNN hub. Direct Amygdala-STG and IFG connections traverse a ‘ventral’ white-matter pathway, while high amygdala-insula functional connectivity and subsequent insula projections along the arcuate fiber bundles connecting STG to IFG furnish an indirect ‘dorsal’ amygdala-cortical pathway. These findings suggest that the amygdala-centric ‘ventral’ pathway synthesizes audio-speech features to form prosodic percepts. Insula vertically integrates this processing stream with ‘dorsal’ pathway processing that incorporates motor representations of prosodic articulation and speech planning.
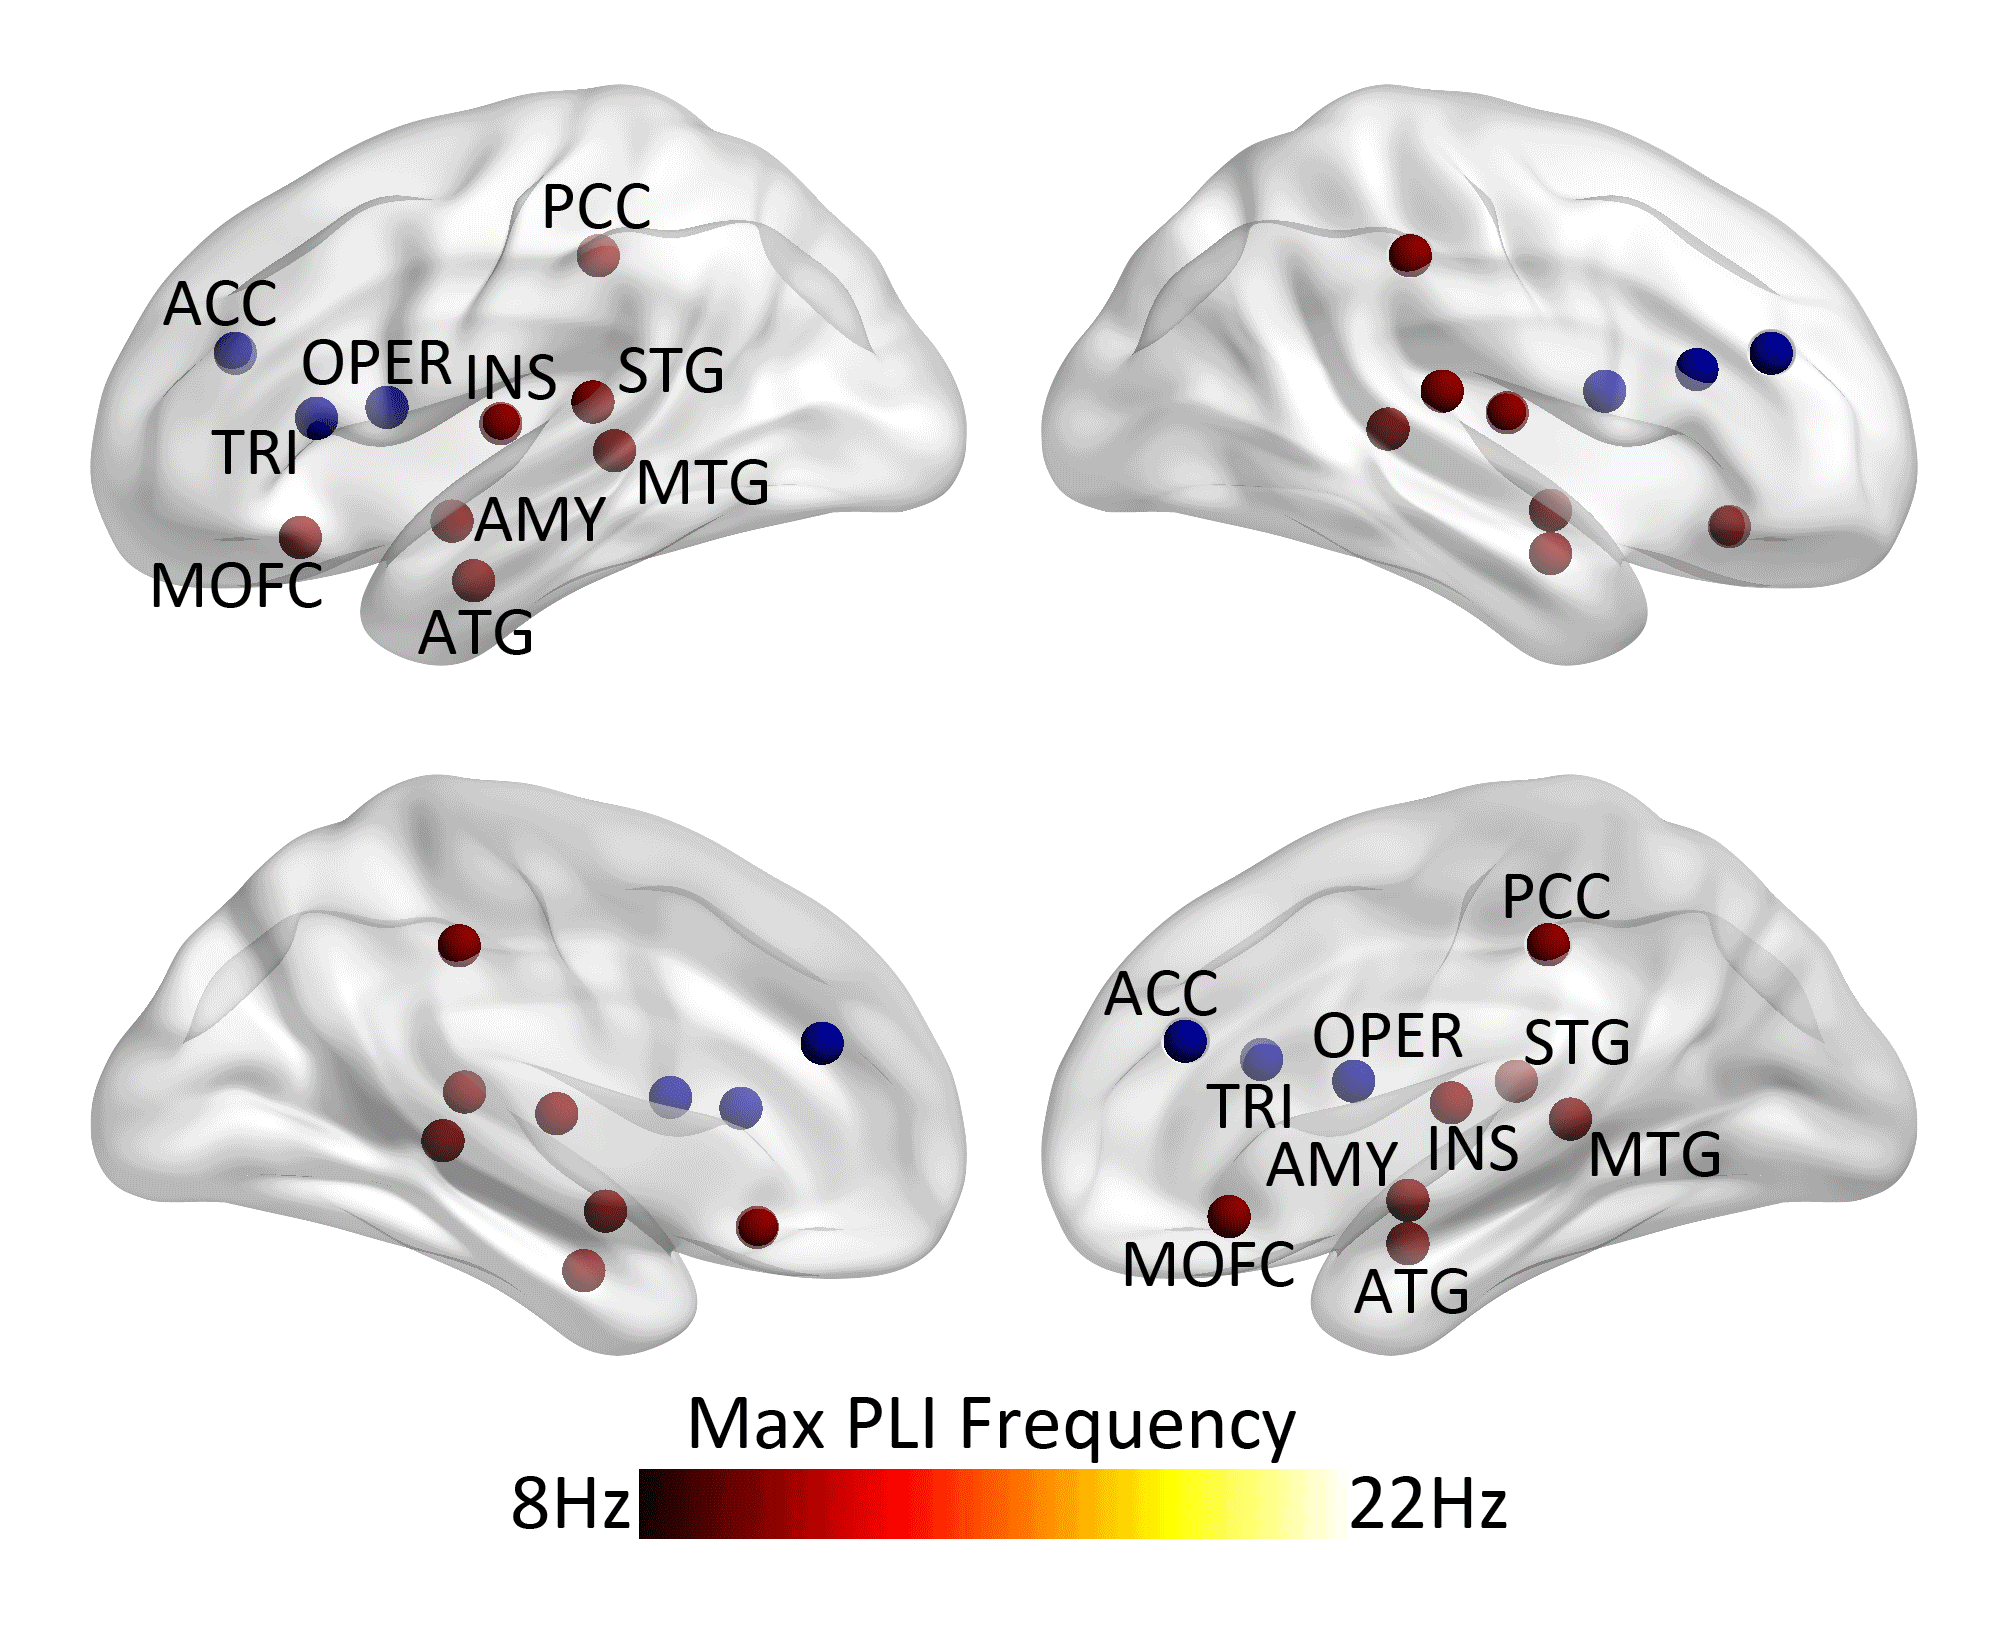
FMRI-Weighted MEG Timeseries Functional Connectivity
Using MEG in combination with MRI mapping of white matter pathways, we were able to examine region-region connectivity within the brain in response to prosodic stimuli . This figure displays the group (N=25) within-hemisphere weighted connectivity pattern across the time windows post stimulus onset (PSO). Blue nodes represent control/evaluative processing regions that in prior studies demonstrated increased activity when the paucity of emotionally salient acoustic features made affective prosodic intent ambiguous. Red nodes reflect regions whose activity positively correlated with increasing prosodic signal richness and hence clearer prosodic intent. Edge color represents connection frequency that ranged across all edges, from 5th percentile=11.9HZ, to 95th percentile = 21.1Hz. Relative edge thickness reflects normalized-Z weighted Phase Lag Index (wPLI) magnitude. Group Z wPLI edge values less than 0.5 are held to uniform thickness and shown as threads to further highlight high-wPLI edges of interest. Proceeding from left to right, during the Early time window, bilateral connectivity primarily reflected interconnections between AMY, insula (INS), and STG. Middle and late time windows in the right hemisphere were characterized by increasing centrality of PCC and MOFC, greater PCC-MOFC connectivity, and greater MTG-MOFC connectivity. Finally, in the left hemisphere, temporal cortical and subcortical regions connections to frontal control regions (TRI, IFG, and ACC) were maximal during the early period and then diminished during the middle and late time windows. PCC connections to left AMY and MOFC present during the early window become more robust during middle and late time windows. In the right hemisphere, this pattern was not observed; however, temporal, insular and subcortical regions maintained connections to each other, MOFC, and to a lesser extent, IFG control regions during middle and late time windows.
Comments are closed.